More revenue doesn’t always mean serving more customers or putting prices up. Increasing how much each customer spends makes the covers you already have more valuable – whether that’s an extra side, a premium option, or a dessert added to the order.
The goal isn’t squeezing more money out of customers. The best average order value strategies make it easier for customers to discover additions or upgrades that genuinely improve their meal.
What is Average Order Value in a restaurant?
Average Order Value (AOV) = Total Sales Revenue ÷ Number of Transactions
Example: £20,000 in sales across 800 transactions gives an AOV of £25.
One distinction worth making early: Depending on how a restaurant operates, average spend per head can be more useful than average transaction value. A table of four spending £100 has an AOV of £100 but a spend per head of £25 — two very different numbers depending on which question you’re actually asking.
Cornell’s restaurant revenue management research treats average check per person as one of several standard restaurant performance measures, alongside factors like table turnover and meal duration. For this article, we’ll focus primarily on AOV (the value of each transaction) while highlighting where spend per head can provide useful additional context.
Why increasing average order value matters
The commercial logic is straightforward. For a restaurant serving 1,000 transactions a month:
| Average order value | Monthly revenue |
| £25 | £25,000 |
| £26 | £26,000 |
| £27.50 | £27,500 |
A £2.50 increase in AOV is £2,500 in additional monthly revenue, without a single extra transaction.
One important caveat: Revenue isn’t profit. The real objective is increasing AOV while paying attention to contribution margin – selling more of a low-margin item isn’t as valuable as shifting the sales mix toward genuinely profitable ones. This is the whole premise behind menu engineering, which Cornell’s menu design research frames as assessing every item by both contribution margin and sales volume together. We’ve covered the full framework separately if you want the deeper version.
12 ways to increase your restaurant’s average order value
1. Use strategic upselling
Upselling, cross-selling and premium substitution are related but distinct tactics, and it’s worth knowing which one you’re actually using:
- Upsell: Regular → large
- Cross-sell: Burger → burger and fries
- Premium substitution: House wine → premium wine
Each works differently. An upsell increases the size or quality of what’s already been chosen; a cross-sell adds something alongside it; a premium substitution swaps the item entirely. The key across all three is relevance and timing – a recommendation needs to make sense alongside what the customer is already ordering, not just be an extra prompt for its own sake.
2. Train staff to make relevant recommendations
Upselling is the strategy; staff training is how it actually happens, consistently, on every table. Train staff to understand which dishes pair well, which extras are available, which items are worth highlighting, today’s specials, and appropriate drink pairings.
A generic “Would you like anything else?” gives the customer very little to respond to. A relevant suggestion (“Would you like garlic bread or olives while you’re waiting?”) gives them a specific option to consider instead.
3. Create meal bundles and packages
Burger, fries and a drink. A lunch menu. Starter and main. A family meal. The aim is to make the step up from a single item to a higher-value order feel worthwhile – someone who intended to order a £12 main may be more willing to spend £17 on a main, side and drink when the package offers clear value. Don’t automatically discount everything in a bundle, though: The customer needs to perceive value, but the operator should calculate the bundle’s actual contribution margin first, not just bundle for the sake of it.
4. Add profitable sides and extras
Sauces, fries, vegetables and bread for restaurants; dips, toppings and stuffed crust for pizza; drinks, sides and desserts for takeaways; syrups, alternative milk and extra shots for cafés. Worth tracking your attachment rate specifically – what percentage of main dishes are currently ordered with a side? If only 15% of burger orders include a side, increasing that to 20% gives you a measurable target, which is far more actionable than simply telling staff to “sell more sides.”
5. Use menu modifiers effectively
Rather than relying on customers or staff to remember what’s available, configure logical modifiers directly into ordering:
Add to your burger:
- Cheese +£1.00
- Bacon +£1.50
- Double patty +£3.00
- Fries +£3.50
Keep modifiers relevant rather than excessive – too many prompts makes ordering cumbersome rather than helpful.
6. Introduce premium options
Give customers a choice rather than simply raising the price of the default item. A house burger at £13, a signature burger at £16, a premium steak burger at £19. Same principle applies to wine, spirits, coffee or portion sizes. This gives customers control over how much they spend, rather than the restaurant deciding for them.
7. Improve menu design and positioning
Use your actual EPOS sales data to sort items into four groups: High popularity and high margin, high popularity and low margin, low popularity and high margin, and low popularity and low margin. Then use that to decide which items actually deserve prominence on the page.
Cornell’s menu-engineering research is built around exactly this – evaluating items by profitability and sales volume together, then adjusting presentation and organisation accordingly.
8. Create minimum-spend incentives
Free delivery over £25. A complimentary side over £30. Bonus loyalty points above £40. The important part is usually setting the threshold slightly above your existing AOV, not picking a round number that sounds nice – if your online AOV is £23, test an incentive around £27–£30, not £50. The economics need to work too: Giving away a £5 item to generate £2 of extra revenue isn’t a win.
9. Promote desserts and after-dinner drinks
Look at how many evening transactions currently include a dessert, coffee or after-dinner drink. If the attachment rate is low, test one change at a time (such as giving customers a separate dessert menu when mains are cleared, or prompting for a coffee pairing) and compare the result. Where alcohol’s involved, keep recommendations responsible – alcohol sales carry their own licensing requirements in England and Wales.
10. Use online ordering to recommend extras
Online ordering makes upselling much more consistent. It can reproduce the useful parts of staff recommendations through prompts – add a dip when a pizza’s added, “make it a meal” when a burger’s added, “fancy something sweet?” at the basket stage.
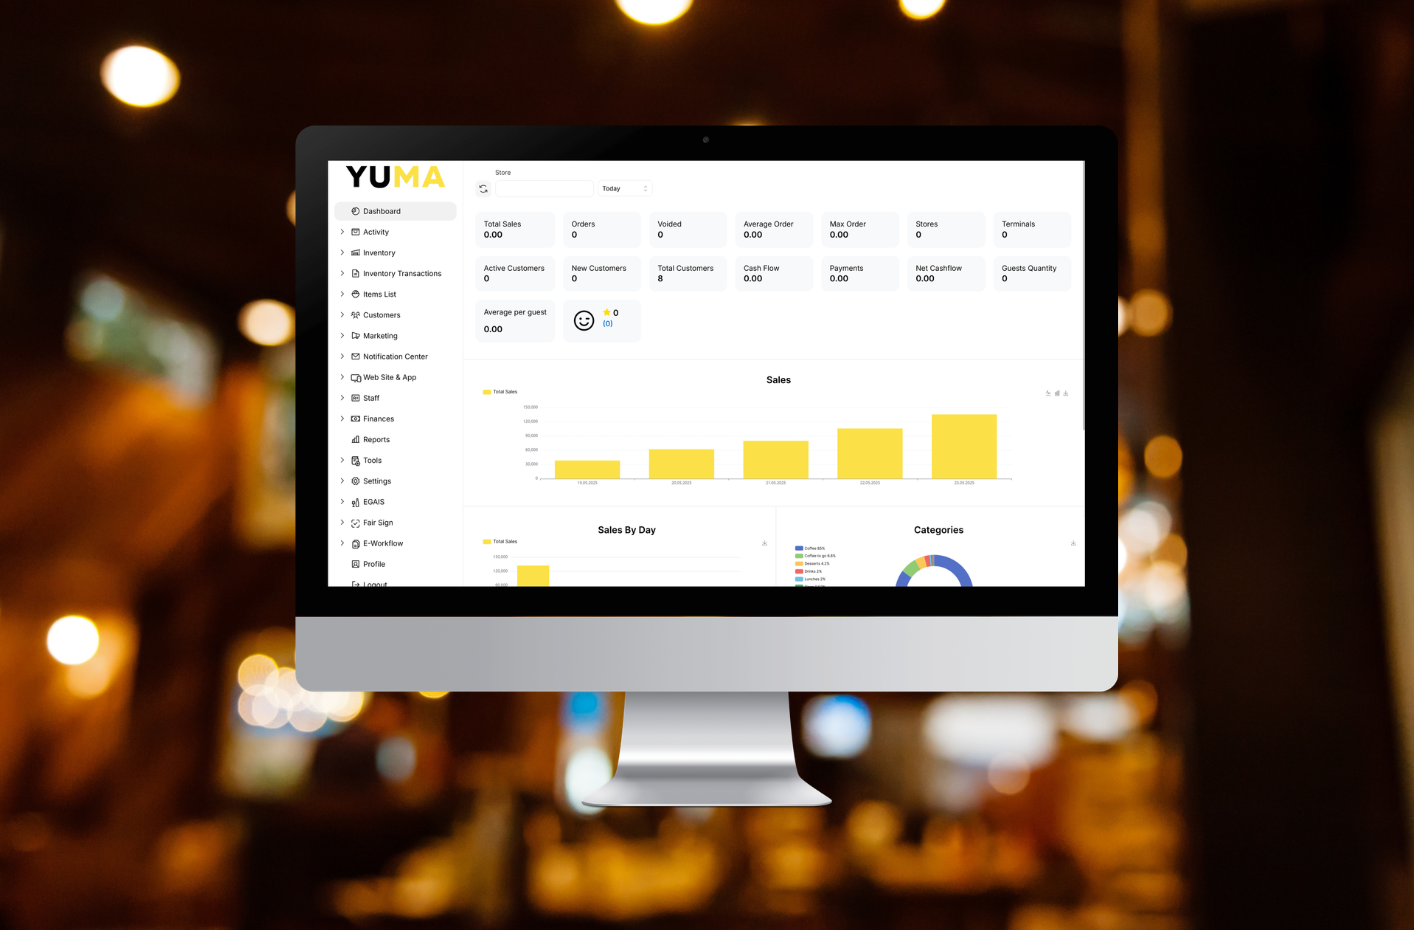
The advantage over relying on staff memory is consistency: The prompt can appear on every relevant order, not just when someone happens to remember. YUMA’s back office lets operators build relevant extras and modifiers into the ordering journey.
11. Build loyalty rewards around spend
A blanket “get 10% off” offer isn’t necessarily designed to increase AOV. A threshold such as “spend £30 and get 200 bonus points” explicitly gives customers a reason to reach a particular basket value. Spend thresholds, bonus points on selected products, or rewards tied to higher-margin categories all push in that direction – just avoid training regular customers to simply wait for the next discount.
12. Use EPOS data to identify opportunities
You can’t properly optimise AOV without knowing what’s actually happening across your sales and reporting data – AOV over time, sales by product, product mix, items per transaction, modifier and extra attachment rates, and performance by day, time, location and ordering channel.
Turn that into direct questions:
Customers buy lots of burgers but rarely add sides → test a side prompt.
Dessert sales are low despite strong evening covers → test staff recommendations.
Premium versions barely sell → review pricing and positioning.
Online AOV is lower than dine-in → review modifiers and basket prompts.
Cornell’s Fairmont Hotels case study is a genuinely useful reference here – a structured revenue-management process that starts with baseline data analysis before selecting which tactics to actually apply, rather than guessing.
How to track whether your AOV is increasing
Don’t just glance at your restaurant EPOS. Establish a baseline and compare like-for-like periods:
| Metric | Why track it |
| Average order value | Main KPI |
| Average spend per head | Controls for different party sizes |
| AOV by ordering channel | Shows whether dine-in, takeaway and online customers behave differently |
| Transactions | Shows whether AOV growth coincides with falling order volume |
| Revenue | Overall impact |
| Items per transaction | Shows whether customers are buying more |
| Modifier/side attachment rate | Measures how well extras are landing |
| Product mix | Shows what customers are shifting toward |
| Gross/contribution margin | Checks whether the extra revenue is actually valuable |
One line worth holding onto: Don’t measure AOV in isolation. AOV rising because fewer customers are ordering your cheapest products isn’t automatically evidence your upselling strategy is working – it might just mean you’ve lost your budget-conscious customers. Compare against the previous four weeks, the previous quarter, and the same period last year where seasonality matters.
Increasing AOV without damaging the customer experience
Any AOV strategy still has to improve (or at least preserve) the customer experience. Constant pop-ups, irrelevant upselling, excessive modifiers, blanket discounting or pressuring staff to push products can quickly become counterproductive.
The better principle is simple: Relevance beats frequency.
The takeaway
Increasing average order value starts with understanding what your customers already buy. Once you can see which products sell together, which extras are being missed, and how spending shifts across different services, you can make far more informed decisions about your menu than guesswork allows.
YUMA brings sales, menu and ordering data together in one system, giving you a clearer picture of what’s selling, what customers are adding to their orders, and where there may be opportunities to increase transaction value.
See how YUMA EPOS helps you understand your restaurant’s performance → Book a demo