The data is showing a big contradiction in hospitality right now: Spending is going up, but profits are going down. It sounds like this shouldn’t be possible. But if you work in hospitality, you can see it for yourself — busier tills, thinner margins, and a feeling that growth on paper isn’t showing up in the bank.
Here’s what’s actually going on, and which numbers explain the gap that total sales can’t.
UK hospitality spending is beginning to recover
The headline figures from Barclays’ latest Consumer Spend Report paint a genuinely encouraging picture for August 2026:
- Overall eating and drinking spend up 1.8% year-on-year
- Pubs, bars and clubs up 2.7%, with transaction volumes also growing 2.9% — more people going out, not just spending more per visit
- Takeaway and fast-food spending up 1.6%, with transactions up 1.3%
- Restaurants, cafés and bakeries up 1.5% — though transactions here actually fell 1.3%
- Overall card spending hit a 13-month high, growing 2.1% year-on-year, building on July’s 2.0% increase
- Consumer confidence in household finances reached a six-month high, at 66%, up from 64% in July
- Hospitality and leisure spending overall rose 3.3%, one of the stronger-performing categories that month
On the surface, this looks like a sector genuinely recovering – rising spend, rising confidence, more people going out. But look closely at that restaurants, cafés and bakeries figure again: Spend up, transactions down. That single line is worth holding onto, because it’s the first clue that this recovery isn’t as straightforward as the headline number suggests.
Higher revenue doesn’t necessarily mean higher sales volumes
Here’s the catch, and it’s already sitting in the numbers above: Restaurants, cafés and bakeries saw spend rise 1.5% — but transactions actually fell 1.3% over the same period. That’s not a business getting genuinely busier. That’s very likely the same number of visits, or fewer, costing more each time.
This matters because “spending is up” and “the business is doing better” aren’t automatically the same statement. There are two very different ways revenue can grow:
- Real growth — more customers, more visits, more items per order. The business is doing more.
- Price-driven growth — the same customers, buying the same amount, just paying more for it. The business isn’t doing more, it’s charging more.
Both show up identically on a simple sales report. Neither is inherently good or bad on its own — menu price rises are often necessary just to keep pace with rising costs — but they tell you completely different things about the actual health of the business, and only one of them reflects genuine demand.
There’s a wider signal here too: Barclays’ own data shows overall card spending grew 2.1% year-on-year in August — but that’s below the UK’s headline rate of inflation at the time. In real terms, once inflation is accounted for, spending across the board may actually be shrinking, even while the headline card-spending figures show growth. Hospitality’s 1.8% eating-and-drinking growth sits in that same uncomfortable position: A positive number that doesn’t necessarily mean people are spending more in any way that matters to volume.
This is exactly why the next figures — the ones from UHY Hacker Young and NIQ/Zonal — matter so much. They’re the numbers that show what happens once rising costs meet revenue growth that may be more about price than volume.
The costs eating into hospitality margins
This is where the real story is. UHY Hacker Young’s analysis of the UK’s Top 100 restaurant groups (based on the most recently filed accounts of operators including Pizza Express, Five Guys, Wagamama and Wingstop UK) lays the whole problem out clearly:
- Combined turnover rose to £13.3 billion, up from £12.9 billion – genuine, real growth on the top line
- Combined profits fell 44% to £204 million, down from £365 million the year before
- That works out to a margin of roughly 1.5% across the sector’s largest, best-resourced groups – the ones with the most purchasing power and the most scope to spread costs across hundreds of sites
- Employment costs rose sharply: Increases to the National Minimum Wage and employers’ National Insurance contributions were named as the single biggest driver
- Business rates increased for many operators on top of that
- Ingredient costs turned genuinely volatile, not just generally inflationary – olive oil, beef, chocolate, coffee, eggs and pasta all rose faster than broader inflation over the period
The accountancy firm’s own partner summed up the mechanism plainly: Rising employment and operating costs absorbed the entire benefit of higher turnover, and then some. Revenue wasn’t the problem, but what happened to it afterwards was.
It’s worth sitting with that margin figure for a second. If the sector’s largest, most efficient groups – the ones best placed to absorb rising costs – are converting £13.3 billion of sales into just £204 million of profit, the arithmetic facing a single independent restaurant, with one kitchen and one payroll and none of that purchasing power, is tighter still.
And it’s not just the big groups feeling this. NIQ’s latest Business Confidence Survey, polling leaders across more than 17,000 hospitality sites, found:
- 52% report their profitability has dropped, or that their business is currently running at a loss or is unviable
- Employment costs have risen an average of 10.7% per person over just two years
Two very different data sets – one covering the biggest groups in the country, one covering thousands of individual sites – telling exactly the same story from two different angles.
Why operators need to look beyond total sales
Put the last two sections side by side, and the pattern is impossible to miss: Spending is up. The biggest, best-resourced restaurant groups in the country are converting that growth into a profit margin of about 1.5%. More than half of operators surveyed across 17,000+ sites say profitability has fallen, or that their business is currently loss-making. None of this shows up if the only number you’re checking is total sales.
That’s the actual lesson here, and it’s a simple one: Total sales, on its own, tells you almost nothing about how a hospitality business is actually doing.
A few ways this plays out in practice:
- A business can grow revenue and lose money in the same quarter. Higher turnover and falling profit aren’t a contradiction – the data above shows it happening across an entire sector at once.
- A “good month” on the till roll can hide a genuinely bad month underneath. Rising costs can eat a sales increase entirely before it ever reaches the bottom line, and a simple sales report won’t tell you that’s happened.
- The businesses managing this well aren’t the ones selling the most – they’re the ones who can see where the money actually goes after a sale is made. Two restaurants with identical sales figures can have completely different financial health, depending on cost control, labour efficiency and waste.
If sales is the only number you’re checking, you’re seeing roughly half the picture – the half that looks encouraging right now, and the half least likely to warn you when something’s actually going wrong underneath it.
So what should you be watching instead?
The hospitality metrics worth watching
Six numbers, together, tell you what total sales can’t. None of them require a data team – just knowing where to look.
Average order value
What it tells you: Whether revenue growth is coming from higher prices, or from customers genuinely buying more per visit.
Why it matters right now: Given that restaurants, cafés and bakeries saw spend rise while transactions fell, this is the number that would actually confirm it – a rising average order value alongside falling transaction counts is exactly the price-driven growth pattern the sector-wide data suggests is happening.
Sales by product
What it tells you: Which individual items are actually driving revenue, and which are just taking up menu space and kitchen time.
Why it matters right now: With ingredient costs moving unevenly – olive oil, beef, eggs and pasta all rising faster than general inflation – a dish that was comfortably profitable a year ago might not be anymore, even if it’s still selling just as well.
Labour vs sales
What it tells you: Whether your staffing cost is scaling sensibly against what you’re actually taking, shift by shift.
Why it matters right now: Employment costs have risen an average of 10.7% per person over two years. A rota built around last year’s cost assumptions is quietly eating more of every pound of revenue than it used to, even with no other changes made.
Peak and quiet trading periods
What it tells you: Where your real demand actually sits across a week or a day, rather than an average that flattens the picture.
Why it matters right now: Spend that looks healthy across a full month can be masking a consistently quiet Tuesday lunch, or a Sunday evening nobody’s addressing – periods costing you in staff and overheads without generating enough revenue to justify them.
Discounts and promotions
What it tells you: Whether revenue is being driven by genuine demand, or bought with margin you’re giving away.
Why it matters right now: In a market this cost-sensitive, discounting can feel like the obvious way to protect footfall – but revenue from a heavily discounted period looks identical to genuine demand on a simple sales report, right up until you check what it actually cost you in margin.
Waste and stock
What it tells you: How much of what you’re buying is actually reaching a paying customer.
Why it matters right now: With core ingredients rising in price faster than general inflation, waste that cost relatively little to shrug off a year ago is a meaningfully bigger loss now, at exactly the same volume. A stock problem that was minor in 2024 is not automatically still minor today.
How hospitality businesses can protect margins without simply increasing prices
Raising prices is the obvious lever, and it’s also the most limited one. UHY Hacker Young’s own data shows the sector has already been pulling it – turnover up £400 million, largely on the back of pricing – and profit still fell 44%. Price alone isn’t solving this, and pushing it further has real limits: Customers notice, and in a market where over half of surveyed operators report falling profitability, they’re not the only ones feeling the squeeze. Value perception erodes fast when it’s the only lever being pulled.
The more durable options sit elsewhere, and they map directly onto the six metrics above:
Tighten food cost through better portion control and recipe costing. If a handful of ingredients are rising faster than general inflation, the dishes built around them need revisiting specifically, not the whole menu repriced evenly.
Reduce waste through accurate stock tracking. The same percentage of waste costs meaningfully more today than it did when ingredient prices were lower – closing that gap protects margin without touching a single price on the menu.
Adjust staffing to match actual peak and quiet patterns, rather than a fixed rota built on assumptions from before labour costs rose 10.7% per person. This is a genuine lever, not a euphemism for cutting hours blindly – it means putting the labour where the sales actually are.
Identify which menu items are quietly dragging on margin before raising a single price. A best-seller with thinning margin needs a different fix than a genuinely underperforming dish – reformulating one and removing the other, rather than applying the same price increase to both.
Review discounting with real numbers, not instinct. A promotion that drives footfall but erodes margin past a certain point isn’t protecting the business – it’s just a slower version of the same problem.
None of these require charging customers more. They require knowing, specifically, where the money is actually going – which is exactly what a simple sales total can’t tell you, and exactly what the six metrics above can.
Turning sales data into better decisions
Everything above depends on one thing: Actually having the numbers, in a form you can act on, without reconstructing them by hand. Average order value, sales by product, labour against revenue, stock variance, discount impact – none of it is useful sitting in five separate places, checked once a quarter if at all.
This is the part that trips a lot of businesses up, and it has nothing to do with willingness. An operator running service, managing staff and dealing with suppliers doesn’t have time to manually cross-reference a till report, a separate stock spreadsheet, and a staffing rota just to answer “was this actually a good month?” By the time that answer’s pieced together, the month’s already over and the next one’s already underway.
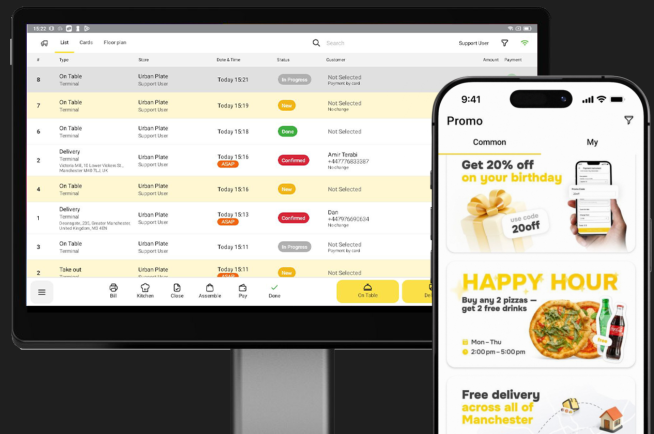
What actually makes this practical is having these numbers visible in one place – sales by item, labour against revenue, stock variance, all updating from the same data as it happens, rather than reconciled after the fact from a till roll. Not a bigger workload. A different one: Checking a dashboard for five minutes instead of building one from scratch every time the question comes up.
In a market where revenue and profit have genuinely decoupled – where the UK’s largest, best-resourced restaurant groups are converting record turnover into a 1.5% margin – the businesses managing this well aren’t necessarily the busiest ones. They’re the ones who can actually see, quickly and clearly, where the money goes after a sale is made.
The takeaway
Spending is rising. For a large share of the sector, profits are not. That gap isn’t really a contradiction, once you look underneath it – it’s costs rising faster than revenue, playing out identically whether you’re one of the UK’s Top 100 restaurant groups or a single independent site. UHY Hacker Young’s own numbers make the scale of it plain: £400 million in extra turnover, and profits still down 44%. Revenue was never the problem. What happened to it afterwards was.
Total sales can’t show you that gap. Average order value, sales by product, labour against revenue, peak and quiet patterns, discount impact, and stock variance can – together, not in isolation, and not once a quarter. That’s the actual difference between an operator who finds out about a margin problem after it’s already cost them a season, and one who catches it while there’s still time to do something about it.
The sector’s spending recovery is real. Whether that recovery reaches your bottom line is a separate question entirely – and one that total sales alone will never answer for you.
Want to see what watching the numbers underneath actually looks like? Book a demo with YUMA and we’ll show you.